
Welcome to our Homepage
We are a sino-german trading company based in Qingdao which provides products & services to domestic and international customers all over the world.
Our company portfolio covers the following business lines:
Import / Export
We can help your business to do sourcing from/to China markets. We have a large supplier base in China and can help & support to conduct quality checks at Chinese suppliers accordingly to international standards (UL/EN/IEC/GB/BS and so on).

German Research & development
We can conduct research and development projects for your business with our international experienced team based in China. We have experience in Design-to-cost (DtC) or Design-to-Manufacuring (DtM) and can deliver your project in time & budget.
")
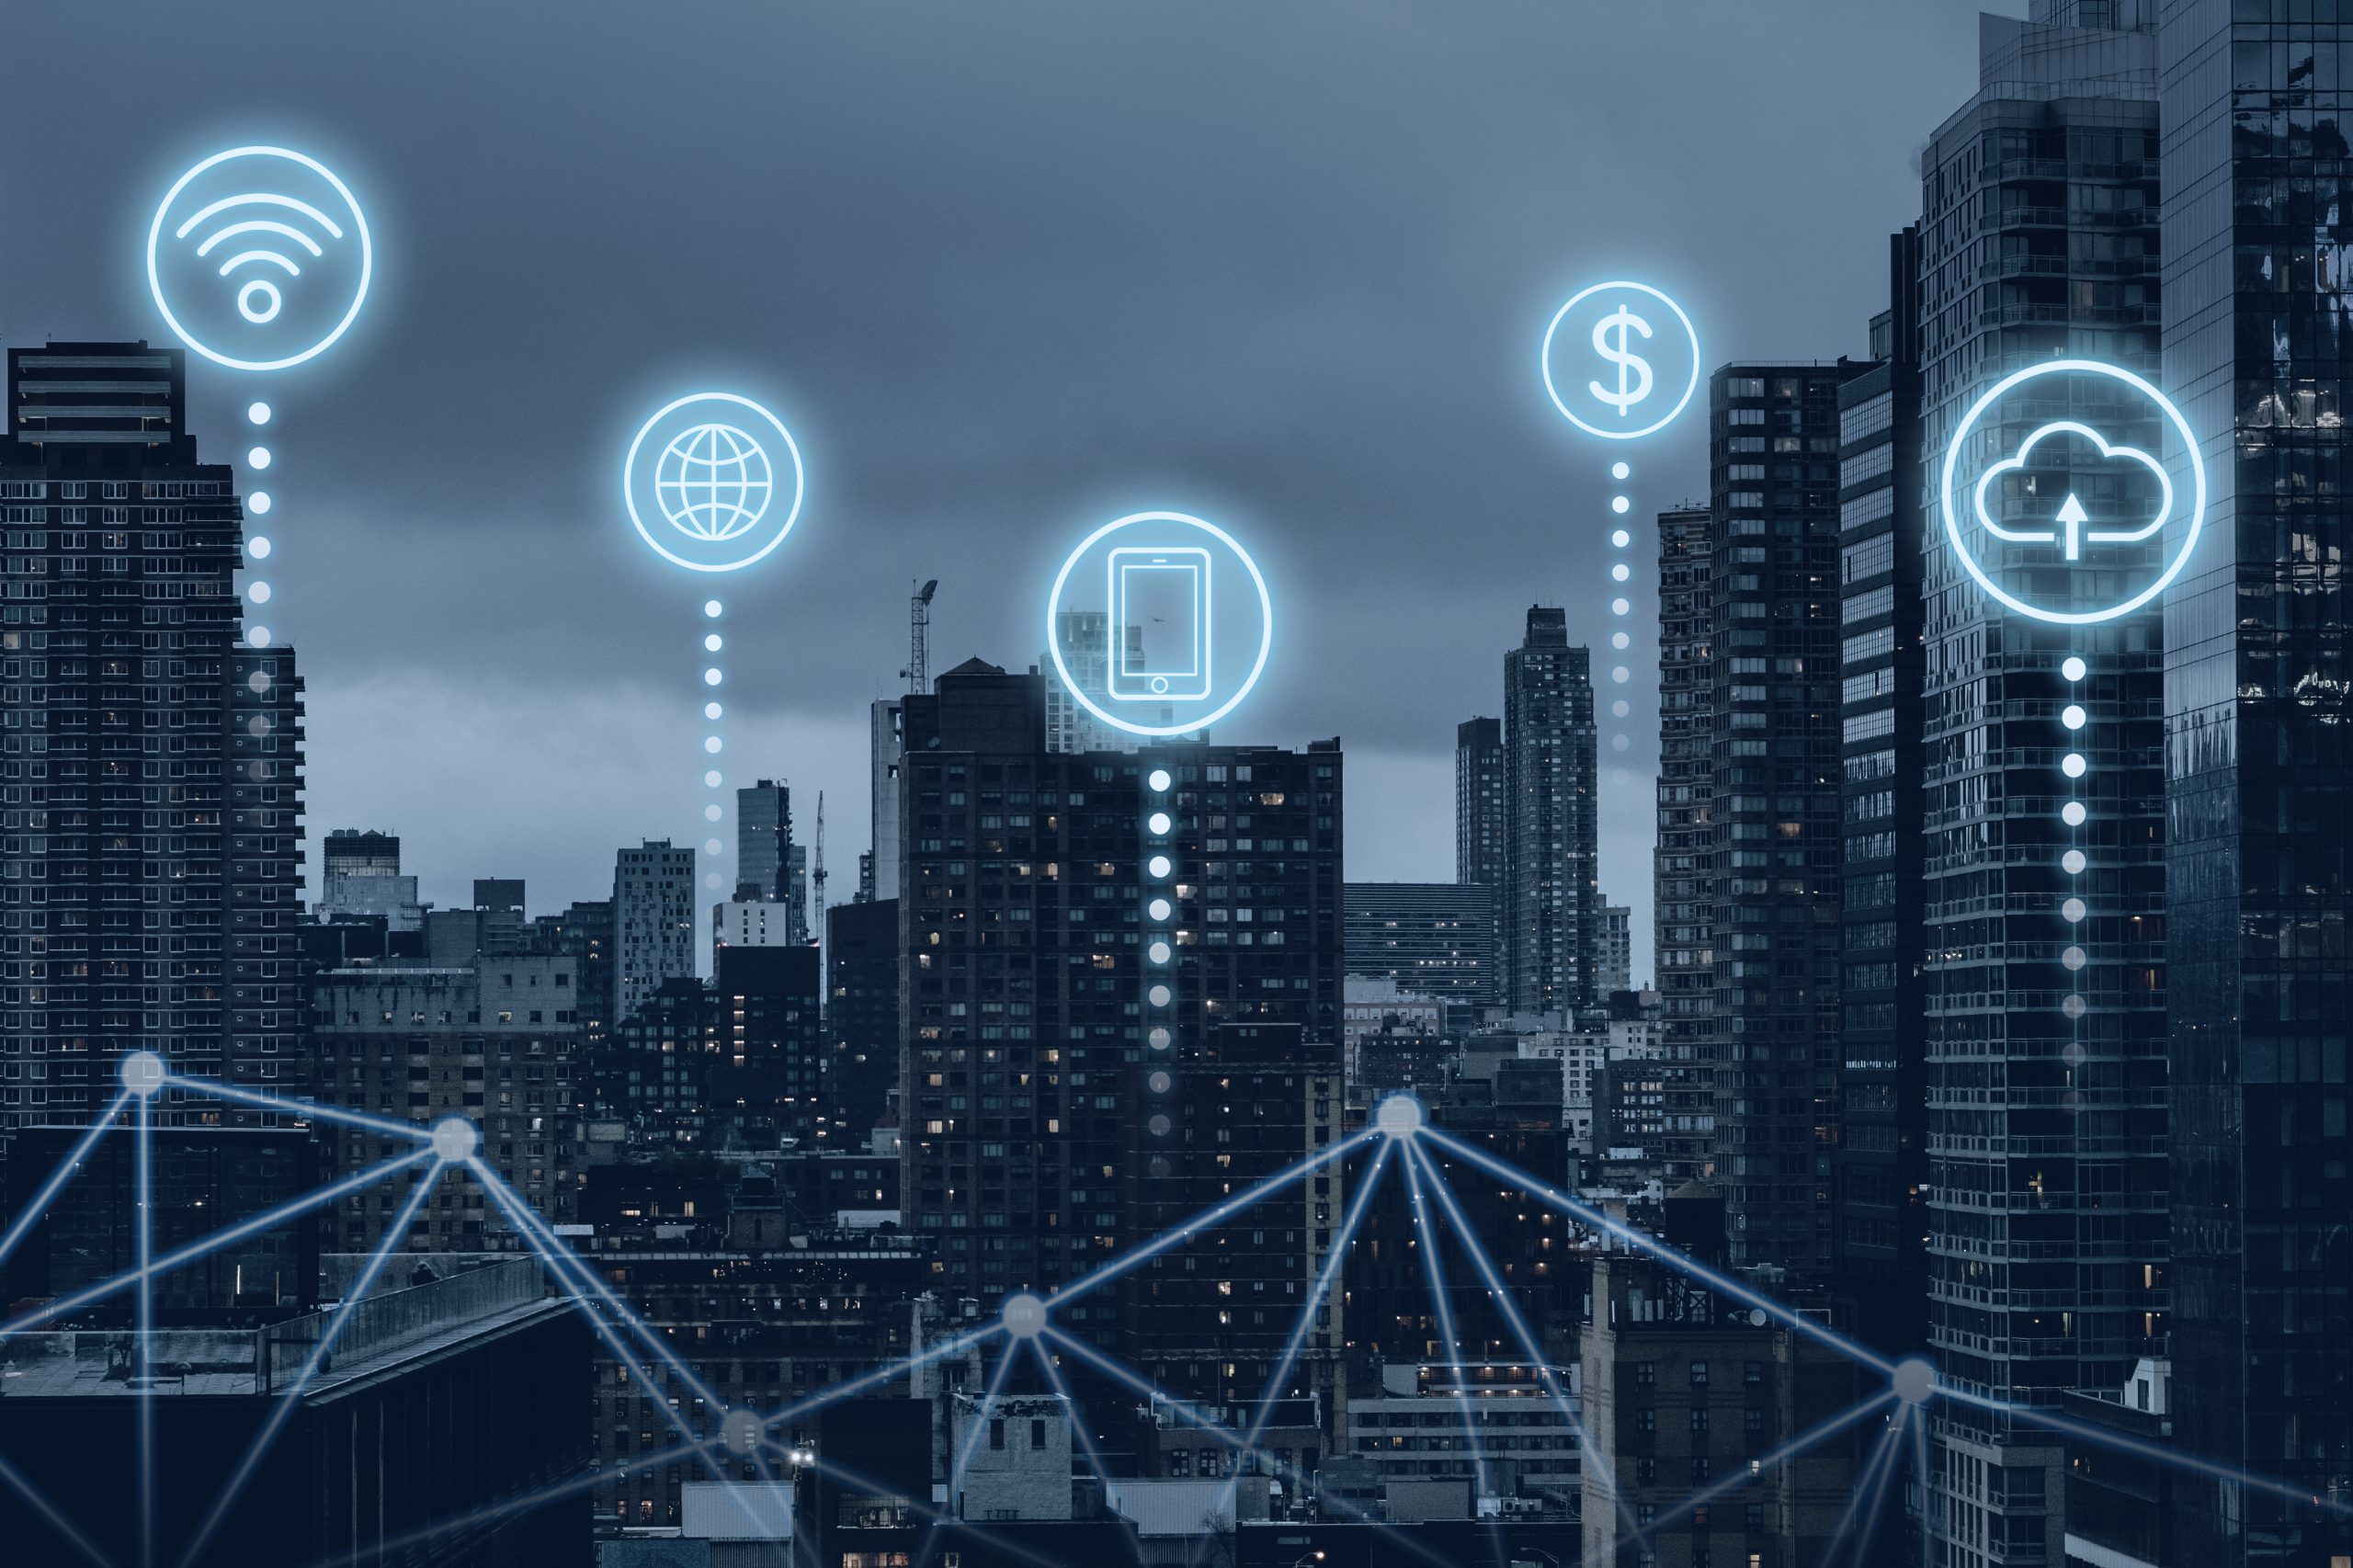
Ecommerce & Blockchain
We can help your business to enter into the Chinese market. Our team is experienced and have required skills in online trading platforms, payment gateways and other financial transaction systems. We have access to latest blockchain providers as well as NFT content creators.
Our headquarter is based in Qingdao and we have a fast network of partners all over China.
Get In Touch
For inquiries or questions you can reach our international team anytime via our contact details below.


- inquries@detectrading.com
- +86 (137) 3096 5950